Case Studies
Case Studies
Case Studies
This project aims to analyze Vrinda Store's sales data using Microsoft Excel to identify trends, patterns, and areas for improvement. By examining key metrics and visualizing data, we will gain insights into product performance, customer behavior, and overall store efficiency.
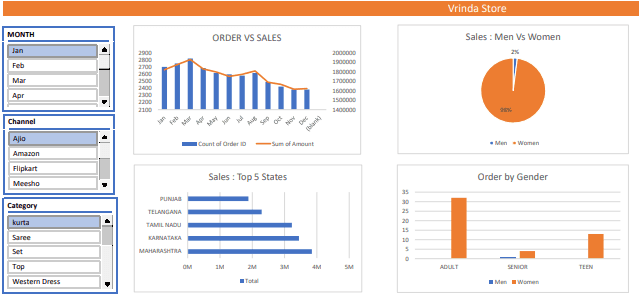
This project aims to analyze Vrinda Store's sales data using Microsoft Excel to identify trends, patterns, and areas for improvement. By examining key metrics and visualizing data, we will gain insights into product performance, customer behavior, and overall store efficiency.
Python-EDA on customer segmentation

Python-EDA on customer segmentation
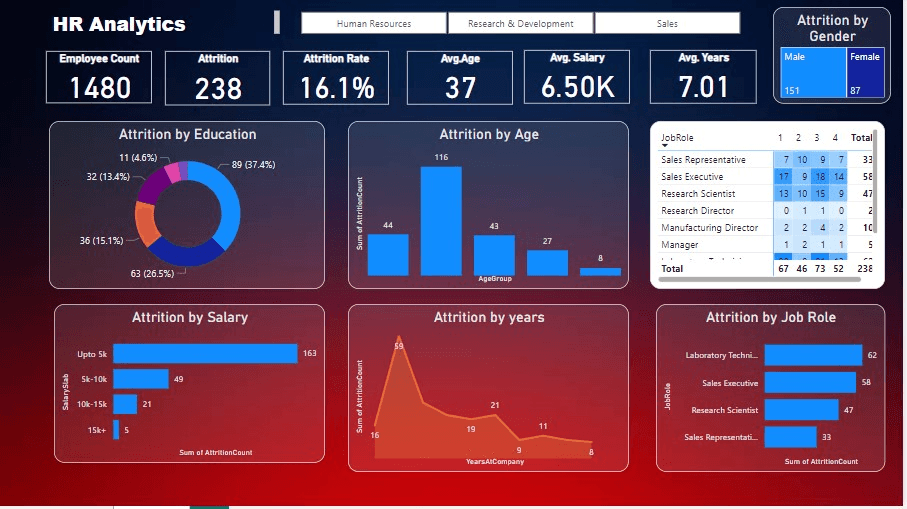
Power-BI-dashboard-on-HR-analytics
This Power BI dashboard is designed to provide actionable insights into employee attrition rates within the organization. By visualizing key HR metrics and identifying trends, we aim to uncover the underlying factors contributing to employee turnover. Through in-depth analysis of various demographic, performance, and job-related attributes, this dashboard will enable HR leaders to make data-driven decisions to improve retention strategies and foster a positive work environment.
Avionics and BVR engagement with enemy aircraft detection using Deep Learning, OpenCV & YOLO
Deep learning, OpenCV, and YOLO are revolutionizing avionics by enabling aircraft to detect enemy aircraft at long ranges (BVR), enhancing situational awareness and reaction times through rapid target identification and tracking.
Enhancing Mobile Banking App Usability
A leading bank wanted to revamp their mobile app to provide a more user-friendly and secure experience

Enhancing Mobile Banking App Usability
A leading bank wanted to revamp their mobile app to provide a more user-friendly and secure experience
Enhancing Mobile Banking App Usability
A leading bank wanted to revamp their mobile app to provide a more user-friendly and secure experience
Enhancing Mobile Banking App Usability
A leading bank wanted to revamp their mobile app to provide a more user-friendly and secure experience
Process
Data analysis typically involves four key steps: Data collection, data cleaning, data exploration, and data modeling. This process begins with gathering relevant data from various sources, followed by cleaning and organizing it to ensure accuracy. Exploratory data analysis (EDA) helps uncover patterns and trends, while data modeling involves applying statistical techniques to derive insights and make predictions.
01
Data Collection
This is the initial phase where you gather relevant data from various sources. These sources can include databases, surveys, experiments, or public datasets. The quality and quantity of data collected significantly impact the subsequent analysis.
Data Cleaning
Once the data is collected, it often contains errors, inconsistencies, or missing values. Data cleaning involves handling these issues to ensure data accuracy and reliability. This step includes tasks like removing duplicates, correcting errors, and imputing missing values.
02
Data Exploration
This phase involves understanding the data's characteristics, distributions, and relationships. It's often referred to as exploratory data analysis (EDA). Techniques like summary statistics, visualizations (histograms, scatter plots, box plots), and correlation analysis are employed to discover patterns and trends.
03
Data Modeling
In this step, statistical and machine learning techniques are applied to the cleaned and explored data to derive insights and make predictions. Depending on the problem, you might use regression, classification, clustering, or other modeling methods. The goal is to build models that accurately represent the underlying patterns in the data.
04
Process
Data analysis typically involves four key steps: Data collection, data cleaning, data exploration, and data modeling. This process begins with gathering relevant data from various sources, followed by cleaning and organizing it to ensure accuracy. Exploratory data analysis (EDA) helps uncover patterns and trends, while data modeling involves applying statistical techniques to derive insights and make predictions.
01
Discover
Brainstorming sessions in order to take their needs and company goals into account. Define the scope and objectives of the project and lays a fundamental foundation for everything that comes after.
Develop
Define the user experience, test and evaluate design concepts, and analyze how your designs will inform behavior and effect the experience of the user.
03
Define
Gather additional information about the ideal client, market opportunities and design sprint. Getting direct feedback from users themselves through user surveys and field activities.
02
Deliver
Determine design patterns, elements of template pages, different framework options, and work with developers to test design functionality.
04
Process
Data analysis typically involves four key steps: Data collection, data cleaning, data exploration, and data modeling. This process begins with gathering relevant data from various sources, followed by cleaning and organizing it to ensure accuracy. Exploratory data analysis (EDA) helps uncover patterns and trends, while data modeling involves applying statistical techniques to derive insights and make predictions.
01
Data Collection
This is the initial phase where you gather relevant data from various sources. These sources can include databases, surveys, experiments, or public datasets. The quality and quantity of data collected significantly impact the subsequent analysis.
Data Cleaning
Once the data is collected, it often contains errors, inconsistencies, or missing values. Data cleaning involves handling these issues to ensure data accuracy and reliability. This step includes tasks like removing duplicates, correcting errors, and imputing missing values.
02
Data Exploration
This phase involves understanding the data's characteristics, distributions, and relationships. It's often referred to as exploratory data analysis (EDA). Techniques like summary statistics, visualizations (histograms, scatter plots, box plots), and correlation analysis are employed to discover patterns and trends.
03
Data Modeling
In this step, statistical and machine learning techniques are applied to the cleaned and explored data to derive insights and make predictions. Depending on the problem, you might use regression, classification, clustering, or other modeling methods. The goal is to build models that accurately represent the underlying patterns in the data.
04


Upgrade your Web
presence with Framer
Schedule a call with Goran B.
Upgrade your Web presence with Framer
Schedule a call with Goran B.
Get Athos Pro
Get Athos Pro
Get Athos Pro